When you are investing money in the stock market, you are investing in businesses believing in the potential of the company and fundamental analysis plays a crucial role in examining the past and projecting the future of the business. Let us discuss the most important aspects and parameters that will definitely help you to analyze a business and confidently choose a fundamentally strong company.
In the world of the Stock Market, there are multiple types of Investors following different trading techniques. Some follow the price movements of a stock by using technical analysis, another category uses a fundamental study of the company financials along with economic parameters and some use a combination of both Fundamental and Technical analysis while investing in a stock. And we would always recommend that prior to investing in a stock an intelligent investor should always select a Fundamentally strong company and Entry / Exit on the same should be as per Technical analysis.
What is fundamental analysis and its importance? What are the types of fundamental analysis? How to do fundamental analysis for beginners? How to analyze stocks or a business? Fundamental vs technical analysis difference. Which shares can be multi-bagger? How to find out long-term investment shares using fundamental analysis?
It’s often seen that the chances of a financially strong company becoming bankrupt or its stock prices tumbling in the long term are relatively low. Companies with strong financial positions will easily recover within a short period of time even if a major correction or fall happens in the whole market, like what we saw during the recent Covid-19 Pandemic situation. Whereas Fundamentally weak stock which has given sudden bull run based on news and rumors will tumble during a market crash and could create irreversible loss to its investor in such cases.

In this section, we would take you a bit deep inside the method of analyzing a company by reviewing the Fundamentals of the company. Fundamental analysis is a hardcore commercial analysis of the books of accounts of a company by various accounting methods and analyzing certain key parameters which give us an idea about the performance of the company in the past and thereby making an assumption or prediction about the near future growth and potential of the company.
In this chapter, we would try to brief you about three major Financial Statements of a company, which are the Balance Sheet, Profit & Loss Statement, and Cash Flow Statement. And the key parameters mentioned in these statements so that our readers could understand these financial statements in a better way and make intelligent decisions during their investment. Additionally, we would also discuss some key ratios like P/E (Price to Earnings), P/BV (Price to Book Value), EPS (Earnings Per Share), Current Ratio, etc, which are commonly used to make a quick Fundamental Study of a company to get an overview of its Financial Performance.
This chapter will be discussing more on the Company Financials in which Chartered Accountants and Commerce background guys will be best at. We would like to make an excuse here that the definitions or explanations which we give will not be exactly what is referred to or described in the accounting standards, as we are a team coming from a technical background. We will share our knowledge and present things in such a way for easy understanding, to fulfill the purpose, and to make our readers capable of reviewing the financial performance of a company by themselves and thereby helping them to make intelligent investment decisions.
So wishing you all a Happy learning experience and Let’s begin our new Journey.

In a broader sense, the Fundamental analysis of a Company involves analyzing three major data.
- Economic Analysis
- Industry Analysis
- Company Analysis
Economic Analysis
Even though our main focus will be on the Company analysis throughout, our readers must remember that just checking the current financial position of a company won’t be enough to make a long-term investment decision. We make an investment in a company by seeing its future growth potentials, right ?. To ensure better future growth for a company, the economic situation of the country in which it operates should be favorable for the business. The economy of the country should be a growing one with rising GDP, Good Forex reserves, Better balance of Exports and Imports, Favourable climatic conditions, Controlled inflation, Stable Govt, and Supporting Socio-Economic Policies, etc. A basic economic outlook is essential prior to making an investment decision, which needs to be gained by staying updated through global and local economic news.
Industry Analysis
After Economic Analysis, we need to have an outlook about the Industry which the company represents. Like IT Sector, Banking Sector, Realty, FMCG, Oil & Gas, Pharma, Automobiles, etc. In Industry analysis, we must try to identify Industries that could benefit from the current economic situation of a country as well as industries that align with the Govts vision and development projects, future goals, etc. We could see the Govt through the PLI scheme is promoting the Manufacturing industries, Higher Infrastructure project funding by Govt can definitely give a boost to Steel, Cement, Paint, Construction Industry, etc. During the Covid 19 Pandemic, Tourism, and Hotel industries took the worst hit whereas Pharma industries were flourishing. Staying updated about the current economic, political, and industrial condition of the country will definitely help you to perform a Fundamental analysis of a company in a much better and systematic manner.
In addition to checking the General Industry to which the Company we analyze represents, it’s always better to dig deep to identify the Industrial sub-type on which the company exactly belongs, so as to have a much better Industrial Growth outlook. For example, we could say the Govt is spending more money on infrastructure development, so in general, the Construction Industry is going to get benefitted. The Construction Industry has subcategories like Steel Sector, Cement Sector, Paint Manufacturers, PVC Pipe Industries, Electric Cable Industry, etc and all these Sub sectors won’t see the same growth, only the pivotal sectors whose products and services are inevitable during these development phases like cement and steel can show much higher growth. So make sure while choosing a company for the investment, the industry as a whole and the Industrial sub-category to which the company exactly belongs could have better future growth and will not be easily wiped out by changing Techno-Economic conditions.

Company Analysis
By purchasing the shares of a company you are becoming an owner of the company, and your rights to exercise ownership power depend on the quantity of the shares you possess. If you could get 51% holdings on a company then your decisions will have an upper hand on the company. Imagine every long-term investment opportunity like you acquire a business, so when you plan to acquire a company what are key parameters you consider ?? (In addition to Economic and Industry analysis)
A few among them can be,
- The Business Model of the Company
- Management / Promoters of the Company (Management Analysis)
- Books of Account of the Company
- The current Customer base of the Company (Market share of the company)
- Future Growth Plans of the Company and so on.
If the business model of the company has an edge over its peers (Competitors), then it will give a boost to company growth and will generate more profits. If the company has a huge customer base and is a market leader in its products, then it could have an additional edge over its peers. The books of accounts will show the financial position of the company, its assets, liabilities, free cash flow, the future orders it grabbed, etc. And to drive the company to success it should have strong management with clear growth plans who knows the pulse of its customers, driving the business from the front with cutting edge technologies in an ethical way.

Hey..!!! As of now you would have got the feeling that where are we going deep and deep ?? Why do we need to know all these things ?? We didn’t get what we came for, the P/E Ratio, P/BV, EPS, Current Ratio, Promoter Holding, Debt to Equity Ratio …. Wait !!! Our readers should realize that knowing only such ratios is not what meant by Fundamental analysis of a company, Fundamental analysis is an in-depth study of the company to determine its future potentials and make intelligent investment decisions, which makes it a hefty and time-consuming task, Mutual Fund Houses always assign Experienced Fund Managers and Research team who performs these studies on every asset class they invest. So it’s really important to have an overall outlook about the company, its business model, current economic and industrial environment, etc. As majority of our reader’s interest lies in knowing these key ratios which we often hear in the market, we could jump into Analysing Books of Account of a company where we will come across all these parameters you often here in the market.

If you have been in the market for a while you might have noticed that all listed companies announce their quarterly results, and also Publishes an annual report. We could get this annual report from the Exchange website or popular websites like screener.in, moneycontrol.com or simply Google it. The Annual report will have almost all the details required for company analysis, it will show the Management team, Books of account, Future growth Plans, Details of Company products, New developments in the company and so on. So Let’s begin analyzing the Financial Position of a company with the Help of 3 Main Financial Statements, which are,
- Balance Sheet
- Profit and Loss Statement (P&L Statement)
- Cash Flow Statement
Balance Sheet
“The Balance sheet is a Financial Statement that shows the assets, liabilities, and capital of a business or other organization at a particular point in time, detailing the balance of income and expenditure over the preceding period.” That’s what came from Google !! In Simple words, the Balance Sheet shows the Financial Value of a Company at the Current Date, i.e its total worth as of today beginning from day 1 of starting the Company. So it will show all the assets and liabilities of the company since it came into existence.
Shown below is the Balance sheet of L&T as at March 31, 2021, extracted from their annual report. As the name itself suggests “ Balance Sheet as at” Meaning from starting of the company to the date mentioned. In this section, we will discuss the major heads of items in the Balance sheet which are in Bold Fonts (Assets: Non-Current Assets, Current Assets, Equity, and Liabilities, etc), which will serve our purpose to get an idea about the financial position of the Company.
The Equity and Liabilities Section shows the Source of Fund and Assets Section shows the utilization of the Funds in a balance sheet and these two Sections must / will tally.


- Assets
The assets of a Company can be classified into two, Current assets and Noncurrent assets. The assets which can be converted into cash or cash equivalent within 1 year from the Balance sheet date are called Current Assets and others are said to be Noncurrent assets.
For example, consider we are running a Restaurant, at the end of FY20-21, ie as of 31st March 2021, we have some fruits and vegetables in stock to be used for the coming days. These stock inventories will be converted into a dish and we will recover the investment money in a few days, so these inventories become our current assets. Whereas the Cold Storage unit and Furniture of our restaurant are meant for the long run and we have no plan of selling them within a year, so these Furniture and Cold storage units are our noncurrent assets whose value will be recovered in the long run.
Current Assets Includes Bank account balance, Trade receivables, Inventories Purchased for products to be manufactured in a year, Short term investments (which will be liquidated in a year), Short term loans given, etc.
Non-Current Asset Includes Long term investments, Long term loans given, Company properties, types of equipment that are to be used for the long term, Inventories for the long term, etc.

- Equity and Liabilities
Equities and Liability Head on Balance sheet shows how the Company has sourced Funds to Perform its activities or get the assets mentioned above. A Company can get money by three means, owners infusing money into the business, taking loans, or from the company business profits.
Equity Section shows the Promoters investment known as Equity share capital / Shareholder Funds which is the amount of money the Promoters have so far invested in the Company. And Other Equity / Reserves and Surplus are the reserves the company owns or simply profits the company made so far as at the Balance sheet date.
Liabilities Section shows the external funds sourced by the company for its business which have to be returned to the lenders within a specific period. Liabilities are classified into two Current Liabilities and Non-Current Liabilities. Liabilities that need to be repaid or settled within a year are called Current Liabilities and those which need to be settled or repaid only after a year are called Non-Current Liabilities.
Current Liabilities Include Short term Loans or borrowings, Trade Payables, Short term debentures issued, etc.
Non-Current Liabilities Include Long term Loans or borrowings, Lease liabilities, Long term debentures issued, etc.
Non-current liabilities are referred to as Debt of the Company, and a company having low debt is always an indication of Good Performance of the Company. If you have checked liabilities of L&T it’s 87,179/- crores, which is a huge amount right ?? And you may think that L&T is under huge debt. But is it really the case? As to the size of L&T, the Debt it has is manageable and the Non-Current Liabilities it has are really low, it’s a company having its own funds of 60,413.54/- crores compared to loan funds of 87,179/- crores. So the Debt / Equity ratio is 87179 / 60413.54 = 1.73. Which is an acceptable figure. Debt to Equity Ratio of less than 2 is often considered as an acceptable figure in the market.
Debt to Equity = Total Liabilities / Total Equity
We will discuss multiple ratios separately later on, but here we mentioned the Debt to Equity Ratio, to make sure our readers realize that we are going through key financial parameters whose comparison with others makes the key Fundamental ratios we hear in the market. Hope you could catch up with the things we discussed…
Profit and Loss Statement
A P&L statement often referred to as the income statement, is a financial statement that summarizes the revenues, costs, and expenses incurred during a specific period of time, usually a fiscal year. This Financial statement represents the performance of the Company for that particular Financial Year.
The below image shows a sample P&L statement of L&T for FY18-19, FY19-20, FY20-21 (Actual P&L Statement from Annual report can be seen when you go further). P&L Statement shows the net profit the company made during a financial year after deducting all expenses, interest on loans, tax, etc.

Sales as we all know reflect the amount generated by the company from its business during the FY, it includes both cash and credit sales. Expenses indicate the amount of money spent to generate that sales, like the purchase of goods, wage, rent payments, etc.
Other Income represents the amount of money the company generated during the FY from activities outside the normal business of the company. It usually reflects the selling of any assets the company owns or any exceptional income received.
Operating Profit / EBITDA
When we deduct all the expenses from the Sales Revenue in a FY, what we get is the Profit made by the company during the Financial Year and is often called as Operating Profit or EBITDA (Earnings Before Interest Tax Depreciation and Amortization). If expenses are more than the revenue generated from sales Operating Profit will be negative, i.e. the company was in loss during that period.
EBIT (Earnings Before Interest and Tax)
Plants, Machinery, Equipment, etc lose their value with respect to time, like the resale value of our car getting reduced every year. Thus the asset value gets depreciated every year and the income tax act specifies the rate of depreciation we can claim for a tax deduction based on the asset category. For tangible assets, the deduction is termed as Depreciation and for intangible assets, it’s referred to as Amortization. When we deduct Depreciation and Amortization for the company assets, which were used for generating sales during the FY from EBITDA we get EBIT value for the FY.

EBT (Earnings Before Tax)
Tax needs to be paid on the actual earnings for the period. The interest amount paid by the company on its liabilities are not taxed on the hand of the company. When we deduct all interest amount paid for borrowings during that FY from EBIT we will get EBT (Earnings Before Tax).
EAT / PAT (Earnings After Tax / Profit After Tax)
This figure represents the net profit of the company after repayment of all liabilities, duties, and tax for that Financial Year. After deducting Tax from EBT we will get EAT for the FY.
We have mentioned earlier that the Balance sheet shows the completed financial performance of the company from the date of induction to the current period. You might be wondering, on the Balance sheet where this Profit or Loss made by the company is reflected. Any Guess ??? While describing the Balance sheet Heads, we have discussed the same. So what’s your answer ?? We will share with you the Full P&L statement from the L & T Annual report below.
If you just go through the P&L report shared, you will notice that the company has made a profit of 11,828.52/- Crores during FY20-21. This value will get reflected in the Balance sheet on the Equity section under Other Equity. If you have checked the Balance sheet the other equity change on FY20-21 with respect to FY19-20 is just above 8,000/- crore, and is not the actual profit that we saw in the P&L statement. Where did the 3000/- crores plus amount go ?? Is something wrong ??. Don’t worry, nothing went wrong, L&T has issued dividends to its shareholders and employees during the FY which accounts for the 3000/- crores plus the amount, and that’s why on the Balance sheet the reserves increased by 8,238.19/- crores even though it made a profit of 11,828.52/- Crores. These details are reflected in the statement of change in equity provided below.


EPS (Earnings Per Share)
Earnings Per Share as the name suggests is the Profit / Earnings made on a single share of the Company. To calculate this figure we need the Total Number of outstanding shares of the company, which is available on the Share Holding Details Furnished in the Annual Report.
EPS = PAT / Total No. of Outstanding Shares
EPS shows the real profitability in the hands of a shareholder, we can compare the EPS of a company with its peers and see which one is giving better profit to its shareholders.

Cash Flow Statement
Sufficient amount of Liquid cash or cash equivalent is required for the smooth business operation of a company. The company has to pay wages to its employees, Rent, Electricity, Water, Internet expenses, etc on regular intervals, and to meet these needs liquid cash must be readily available. What the P&L statement does not reflect is the Free cash available in the company to meet these operating expenses.
There is a possibility that the P&L statement can show the net profit of the company as a good figure, but still, the company can be in a situation to borrow money to meet its operating expenses. That sounds confusing and contradicting, right ?? How can a net profitable company run short of money to meet such expenses ??. If you have paid attention to how we defined Sales figures in a P&L statement, you might be able to answer it. In the P&L statement the sales figures represent the overall sales made during the FY, it includes both cash and credit sales. If the company has made the majority of its sales in credit and if it could not collect the trade receivables on time, the P&L statement will still show good net profit value but in reality, the company did not receive that much amount in cash due to large credit sales. In such a situation the company will be forced to borrow money even to pay its tax liabilities and meet operating expenses. If the company fails to effectively recover trade receivables on time, then the whole financial position of the company can be disturbed.
That signifies the importance of checking the Cash Flow Statement of a Company. Every company should maintain a healthy cash flow statement, with sufficient free cash flow to meet its operating expenses. For Startups and Newly established firms, Cash flow statements won’t be that much attractive as they are during the initial stages of growth and might be investing more into assets acquisition and developments, which is the right thing to do in the context. But a firm established over 5 years should maintain a good free cash flow, to effectively manage the business.
A Cash Flow Statement has 3 Sections,
- Cash Flow from Operating Activities, which shows the cash which the company received from its business operations. A positive Operating Cash Flow shows fewer credit sales and a quick recovery of trade receivables.
- Cash Flow from Investing activities, which shows the cash that the company generated from its investments like dividends received, sale of assets, etc. It also shows whether the company has made any new investments like the purchase of assets, machinery, etc. Investments beyond capabilities are a risk, so it should be a comparable healthy value with respect to the overall financial position of the company.
- Cash Flow from Financing activities: It shows whether the company has taken any new financial liabilities or repaid its existing liabilities. A negative cash flow on this head means that the company is repaying its debts, which is a good sign.
The below Image shows the Cash Flow statement of L&T during FY20-21, extracted from its Annual report.


Key Parameters for Analysing Performance of a Company
In the previous sections we have discussed in detail about the three main Financial Statements of a Company which gives a clear picture of the financial performance of a Company, you have to keep in mind the terms we discussed there as we won’t elaborate them here. Analysts have developed certain key Parameters and Ratios from these Financial statements to get a quick glimpse of the company’s performance rather than going deep into each of these financial statements. So let’s discuss some of the major Financial Ratios and Parameters used while performing a Fundamental analysis of a Company

- Current Ratio or Liquidity Ratio
It’s a ratio used that gives us an idea about the liquidity position of a company. It’s a comparison of the Current Assets and Current Liabilities of the Company. If the current Liabilities of a company, i.e. the borrowing it has to return within a year, is greater than the current assets then the company will be forced to borrow more money to meet its current liabilities, which will be a bad sign. So a current below 1 Suggests that the company maintains a good balance of its assets and liabilities.

- Solvency Ratio or Debt to Equity Ratio
Debt to Equity Ratio shows us the extent of Long term liabilities the company has. As we all know a lower debt value is always the best for a company. Here the Comparison is made between the company’s own Funds (Total Equity) with respect to the Liabilities it has.

A lower ratio is better, but in general, we can say anything below 2 can be considered as a fairly good financial position.
- ROCE (Return on Capital Employed)
This ratio shows how much return the Company was able to generate with respect to the amount invested or spent on the company. It indicates the Profitability and efficient capital utilization of a firm. Higher ROCE is always better.

Capital Employed = Total Assets – Current Liabilities
The Capital Employed shows the total amount utilized by the company during that period which will be the sum of the Company’s own funds (Total Equity) and Non-Current Liabilities.
ROCE value of a company should be at least 15%, as we know bank FD’s could give us a return of 7% – 8%, so when we are putting huge efforts in running a company it has to give fair returns to our efforts and investments. That’s why we considered 15% as a fair ROCE value a company should possess.
- ROE (Return on Equity)
It’s a ratio that shows the Return generated by the Company to its investor’s amount. While calculating ROE we do not take into account the borrowed money.

A Higher ROE shows good Profit-making capability to the investor’s amount, but it should be compared with ROCE to get a clear picture of the profitability of the company.
- Book Value (BV)
Book Value shows the Net worth of a company as on a specific period of time.
Book Value = Assets – External Liabilities
- Price to Earnings Ratio (P/E)
It’s one of the valuation methods of a company considering the EPS it generated during the Financial Year and comparing it with the current market price

For Example, assume that the current P/E ratio of L&T is 20, which means that we are paying 1600 Rs to get an Earnings of 80 Rs a Year, which in turn means that the stock is trading at a premium of 2000% i.e. 20 times with respect to its EPS. We can’t say that a P/E value less than X or Y is good, it should be compared with the Industrial P/E to get a better understanding of the company valuation. If the P/E ratio of a Low debt, highly profitable company is below the average industrial P/E, then we could say that the stock is undervalued and is at the right time to make an investment if the rest of the Fundamental and Technical Parameters are in favor.
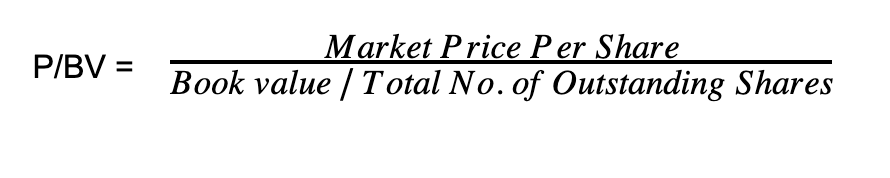
- Price to Book Value Ratio (P/BV)
This is another valuation method, where the current market price of a company share is compared with its Book value, to identify whether the stock is trading at a low or high premium.
- Shareholding Pattern of the Company
Suppose you are starting a business with your friend, then you two will be the promoters of the company having a shareholding of 50% by each. Your Company is running in great profits and to grow it further the company is listed in the stock exchange by issuing 25% shares to Public. Now as promoters you guys will have a 37.5% stake for each in the company, making the total promoter holding to 75%. As per SEBI regulations, the promoters should hold a minimum of 25% shares for a Family run business.
Pledging of shares is a process where one borrows money from financial institutions by providing Shares of the Company as collateral. If the company is under financial pressure, the promoters may pledge a certain amount of shares to raise funds. A low promoter holding in the company, as well as a high percentage of Pledged shares, are signs of poor financial performance of the company.
So when considering an investment in a company, always check the Promoter Holding in the Company, Percentage of Promoted Pledged Shares, as well as Institutional Holding in the Company. A significant quantity of FII and Mutual Fund Houses ShareHolding in a company means that the Institutional investors are bullish on the company, which can be considered as a sign of sound performance and growth potentials of the Company.

The above Figure Shows the Shareholding Pattern of Reliance Industries Limited from 2018 to 2020. An increase in Promoters, FII, DII holdings in the company could be an indication of a better future of the company in the long run.
Shareholding Structure of a Company may be provided in the Annual report or is available on Market research websites like www.moneycontrol.com / www.tickertape.in / www.screener.in etc. The Financial Statements and Ratios that we discussed are readily available in these websites, so you don’t have to do all those calculations and dig deep into the annual report to get all this data. Check out those websites and go through the financial statements of your favorite stocks as an exercise. Keep in mind that it’s always good to go through the annual report of a company where you plan to make some decent investment to have a better understanding of the business, their products, future plans, etc.
As we said earlier, it’s equally important to carry out the Economic, Industrial, and Management analysis along with analyzing the financial statements of the company. The industrial and business model analysis is subjective, a business model and management style that sounds good for one person may not be that much fascinating to another. So we are leaving those things upon you. Before investing, do research about the business model of the company and future potential it has to have an alignment with your perspectives.
We are winding up the Article on Fundamental Analysis of a Company here, Hope that our readers have gained some valuable knowledge, and are able to analyze the financial statements of a company in a much better way. It’s always better to invest in fundamentally strong companies at better valuation along with technical analysis so that our investments will turn out to be the best decision we made in the long run.
Thanking you for your valuable time and continued support. Wishing you happy learning and success in your investments. !!!!

Leave a Reply