
How to Make Money When the Market Is in a downtrend?
A bullish market often rewards almost all market participants, derivative traders, short-term investors, long-term investors, intraday traders, etc, and such a bull run is welcomed by all when the local and global economic cues along with socio-political situations of the country are positive. But we all know that the market cannot remain in a bull run all the time, when the economic outlook turns negative or any unprecedented events hit the market changes its phase to the Bear mode. The real test of a market participant comes in the bearish market, it will sweep away all those novice traders, event and news-based short-term investors, and will even make a dent in the long-term investment portfolio if you haven’t invested in a fundamentally strong company.
If one invests in a fundamentally strong business, he could hold on to his position even if it falls up to an acceptable limit in a bear market, because of the belief in the business in the long run. Surviving a bear market and making profits will be a lifetime learning lesson that could give you a new perspective on the market and makes one capable to survive in the market for long.
In our previous articles, we have discussed Credit and Debit spread strategies to capitalize on a Bull run, What we will be discussing in this article is similar basic spread strategies that we could effectively use in a Bear Market. Let’s discuss in detail about Bear Put Spread, which is a Debit spread strategy to capitalize the bearish phase of the market.
Bear Put Spread consists of an
- ITM Put Option Buy leg and
- OTM Put option Sell leg

When we have a moderately bearish outlook on the market, we could consider buying a Put Option to trade with the market movement and capitalize the same. A simple naked buy option possesses the risk of higher losses if the trade moves against our view, so to limit the loss an OTM put option is sold thereby defining the max profit and loss the trade could have. Bull put spread is initiated when we have a moderate bearish view on the market, i.e. we expect the market won’t go below a significant support point by expiry. The OTM Put option sold is selected based on our analysis of potential major support the stock or index has and breaking the same is not expected within the expiry period.
The ITM put option which we bought will have a higher premium and the OTM put option sold will recover a portion of the same but not in full. Thereby making the overall trade a Net Debit Strategy. The key parameters of the trade are as below,
Spread of the Trade = OTM Sell Strike – ITM Buy Strike
Net Debit = ITM Leg Premium – OTM Leg Premium = Net Premium Paid
Max Profit = Spread – Net Debit
Max Loss = Net Debit
Breakeven = ITM Buy leg strike – Net Debit
Calculations
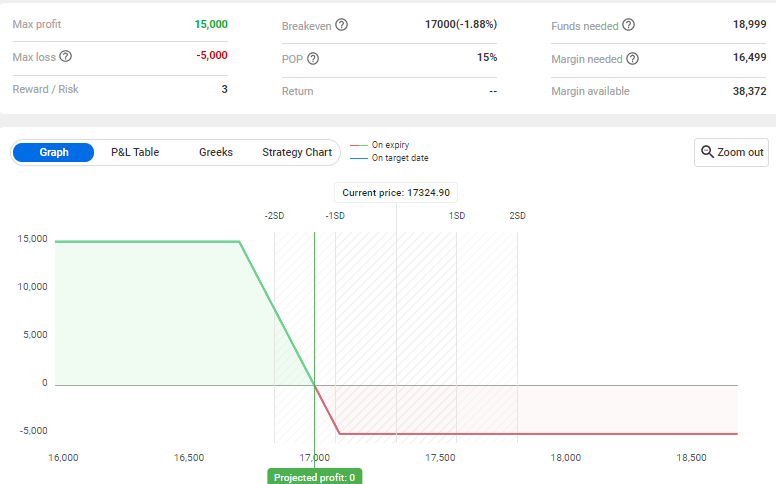
Let’s analyze the strategy with an example. Assume the Nifty is trading at 17000, and due to some local and global economic conditions, we feel that the market can go down from this level. By keeping that view in mind we buy a 17100 PE at a premium of 150/- for a total of 7500/- Rs. From our analysis, we find that 16700 is an important support for Nifty and believe the same will not be breached by the expiry. Keeping our perspective of Nifty trading in the range of 17000 and 16700, we sell 16700 Put options at a premium of 50/- and receive 2500/- Rs. The overall trade has cost us 5000/- Rs and if the trade goes against our view and the market becomes bullish, the maximum loss we could suffer is the net premium paid for the trade which is 5000/- Rs. But if the trade goes as per our view and the market falls the trade becomes profitable with a maximum profit potential of 15,000/- Rs, if the market expires at 16700.
Buy Leg = 17100 PE at a premium of 150/- = 150 x 50 = 7500/- Rs [Debit]
Sell Leg = 16700 at a premium of 50/- Rs = 50 x 50 = 2500/- [Credit]
Net Debit = Net Premium Paid = 150 – 50 = 100/- Per lot
Max Loss per lot= Net Premium Paid = 5000/- Rs
Spread = Buy Strike – Sell Strike = 17100 – 16700 = 400
Max Profit per lot= (Spread – Net Debit ) x 50 = (400 – 100) X 50 = 300 x 50 = 15000/- Rs
Breakeven = Buy leg – Net Debit = 17100 – 100 = 17000.
The Strategy Payoff Table and Diagram are as shown below, which will give you a clear picture of the overall trade.
| Buy Leg IV | Buy Leg Premium | Buy Leg P/L | Nifty Spot at Expiry | Sell Leg IV | Sell Leg Premium | Sell Leg P/L | Combined P/L |
| 600 | -150 | 22500 | 16500 | 200 | 50 | -7500 | 15000 |
| 550 | -150 | 20000 | 16550 | 150 | 50 | -5000 | 15000 |
| 500 | -150 | 17500 | 16600 | 100 | 50 | -2500 | 15000 |
| 450 | -150 | 15000 | 16650 | 50 | 50 | 0 | 15000 |
| 400 | -150 | 12500 | 16700 | 0 | 50 | 2500 | 15000 |
| 350 | -150 | 10000 | 16750 | 0 | 50 | 2500 | 12500 |
| 300 | -150 | 7500 | 16800 | 0 | 50 | 2500 | 10000 |
| 250 | -150 | 5000 | 16850 | 0 | 50 | 2500 | 7500 |
| 200 | -150 | 2500 | 16900 | 0 | 50 | 2500 | 5000 |
| 150 | -150 | 0 | 16950 | 0 | 50 | 2500 | 2500 |
| 100 | -150 | -2500 | 17000 | 0 | 50 | 2500 | 0 |
| 50 | -150 | -5000 | 17050 | 0 | 50 | 2500 | -2500 |
| 0 | -150 | -7500 | 17100 | 0 | 50 | 2500 | -5000 |
| 0 | -150 | -7500 | 17150 | 0 | 50 | 2500 | -5000 |
| 0 | -150 | -7500 | 17200 | 0 | 50 | 2500 | -5000 |
| 0 | -150 | -7500 | 17250 | 0 | 50 | 2500 | -5000 |
| 0 | -150 | -7500 | 17300 | 0 | 50 | 2500 | -5000 |
| 0 | -150 | -7500 | 17350 | 0 | 50 | 2500 | -5000 |
| 0 | -150 | -7500 | 17400 | 0 | 50 | 2500 | -5000 |
| 0 | -150 | -7500 | 17450 | 0 | 50 | 2500 | -5000 |
| 0 | -150 | -7500 | 17500 | 0 | 50 | 2500 | -5000 |
From the Payoff chart and Table, you might have observed that both the Max profit and Loss are capped to a value, which is one of the main characteristics of Spread strategies. Even before entering into a trade the maximum risk and reward are well defined in these strategies so that a better trade decision can be made in accordance with the market conditions.
Having a good knowledge of Bear Market Option Strategies and making use of them at the right time will help you to beat the market even if it’s in a Bearish phase, So keep learning and make the movements of the market in your favor.

Leave a Reply